Power BI is a powerful business analytics tool developed by Microsoft that enables users to visualize data and share insights across an organization. It connects to multiple data sources, transforms raw data into interactive reports and dashboards, and provides real-time analytics for informed decision-making. With features like AI-powered analytics, automation, and seamless integration with Excel and other Microsoft products, Power BI helps businesses streamline data-driven strategies efficiently.
1. Interactive Visualizations Great Feature of Power BI

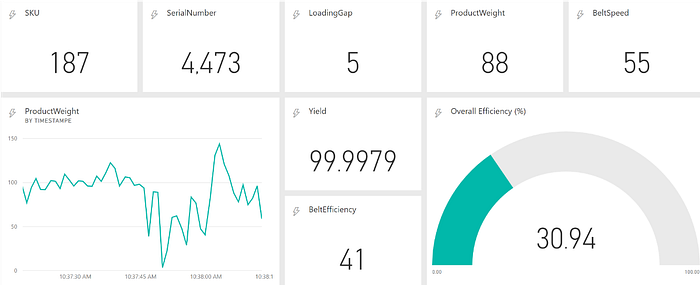
Power BI is one of the greatest tool developed by Microsoft. It is replacing many tools used in data automation. Power BI enables, all type of interactive and dynamic visualizations and detailed in depth data through charts, graphs and maps. This helps alot in developing data driven culture.
How to Use:
-
Drag and drop data fields onto the report canvas to construct visuals.
-
Utilize the Visualizations pane to choose and customize chart types.
-
Configure interactions between visuals using the Edit Interactions feature.
2. Data Connectivity
Power BI supports connections to a wide array of data sources, including Excel, SQL Server, cloud services, and various online platforms. This is very much helpful in extracting data from anywhere, which reduces limitation of data manipulation.
How to Use:
-
Click on Home > Get Data to view available data connectors.
-
Select the desired data source and provide necessary credentials.
-
Load or transform the data using Power Query before integrating it into your reports.
3. Power Query for Data Transformation
Description: Power Query is a built-in tool that allows users to extract, transform, and load (ETL) data from various sources, facilitating data cleaning and shaping.
![]()
How to Use:
-
After connecting to a data source, click on Transform Data to open Power Query Editor.
-
Apply transformations such as filtering rows, renaming columns, and merging tables.
-
Click Close & Apply to load the transformed data into Power BI.
4. Custom Visualizations with R and Python
Description: For advanced analytics, Power BI supports integration with R and Python, enabling the creation of custom visuals and statistical analyses.
How to Use:
-
Install the necessary R or Python environments on your system.
-
In Power BI Desktop, select the R or Python visual from the Visualizations pane.
-
Write and execute scripts within the provided scripting editor to generate visuals.
5. Real-time Data and Streaming
Description: Power BI can display real-time data by connecting to streaming data sources, allowing for up-to-date dashboards and reports.
How to Use:
-
Set up a streaming dataset in the Power BI service by navigating to My Workspace > New Streaming Dataset.
-
Use APIs or Azure Stream Analytics to push data into the streaming dataset.
-
Create dashboards that reference the streaming dataset to visualize real-time data.
6. Automatic Data Refreshes
Description: Power BI allows scheduling of automatic data refreshes to ensure reports and dashboards display the most current data.
How to Use:
-
Publish your report to the Power BI service.
-
In the dataset settings, configure the Scheduled Refresh options by specifying the frequency and time.
-
Ensure data gateways are configured if accessing on-premises data sources.
7. Mobile Accessibility
Description: Power BI offers mobile applications for iOS, Android, and Windows devices, enabling users to access reports and dashboards on the go.
How to Use:
-
Download and install the Power BI mobile app from your device’s app store.
-
Sign in with your Power BI account to access your workspaces, reports, and dashboards.
-
Use touch gestures to interact with and explore data visualizations.
8. Integration with Excel
Description: Power BI seamlessly integrates with Excel, allowing users to import and analyze Excel data, as well as publish Power BI reports to Excel.
How to Use:
-
Import Excel files into Power BI using the Get Data feature.
-
Use the Analyze in Excel option to create PivotTables and charts based on Power BI datasets.
-
Publish Excel reports to the Power BI service for broader sharing and collaboration.
9. Row-Level Security (RLS)
Description: RLS enables the restriction of data access for specific users, ensuring that individuals only view data pertinent to their roles.
How to Use:
-
Define roles and rules within Power BI Desktop by navigating to Modeling > Manage Roles.
-
Specify DAX expressions to filter data for each role.
-
Assign users to roles in the Power BI service under the dataset’s security settings.